What is PageSpeed Insights?
Google PageSpeed Insights is a free tool for analyzing a webpage’s speed, user experience, and performance. It helps identify issues that slow down your page and suggests performance improvements for both mobile and desktop devices.
PageSpeed Insights also measures your Core Web Vitals, which are critical for user experience and affect the rankings in search results.
Overview of the PageSpeed Insights Tool
The tool reports on various metrics and usability factors, categorized into:
- Core Web Vitals
- Performance
- Accessibility
- Best Practices
- SEO
We will now address the metrics and usability factors measured and reported by the PageSpeed Insights tool below.
1 Core Web Vitals
Core Web Vitals are the metrics Google uses to measure the load performance, interactivity, and visual stability of a webpage. The metrics used to measure the Core Web Vitals include:
PageSpeed Insights also reports on other metrics that are not part of your Core Web Vitals but could impact the user experience of your page. These metrics include:
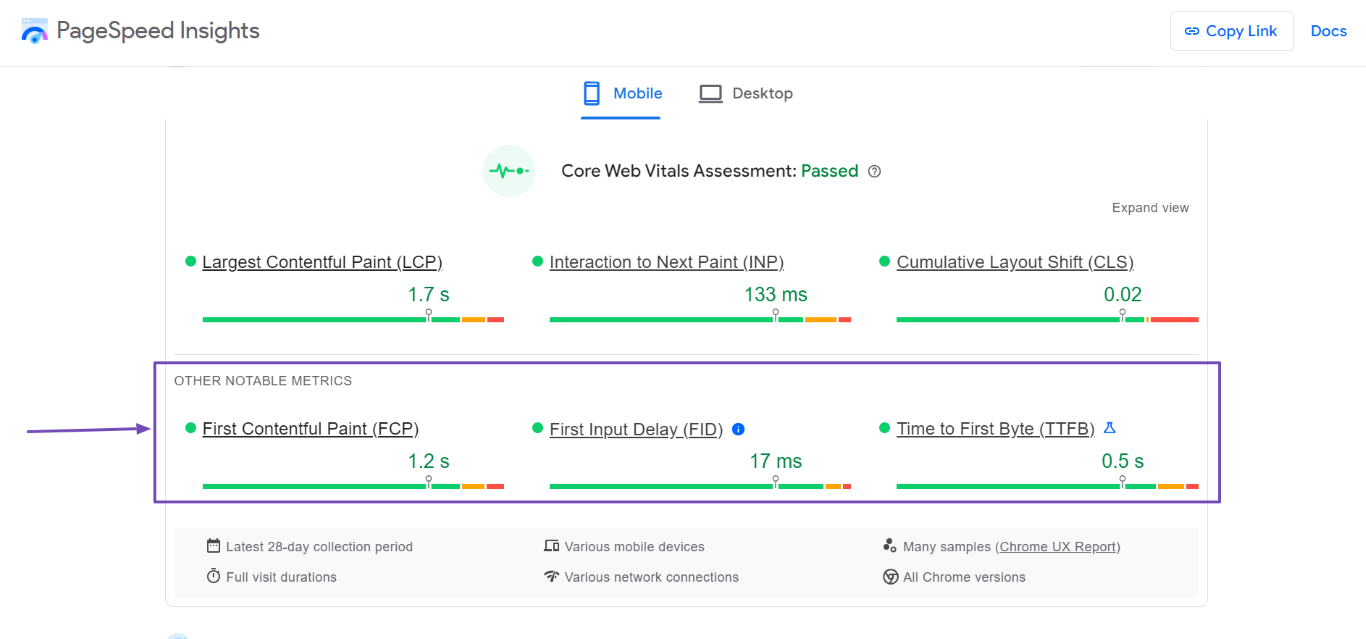
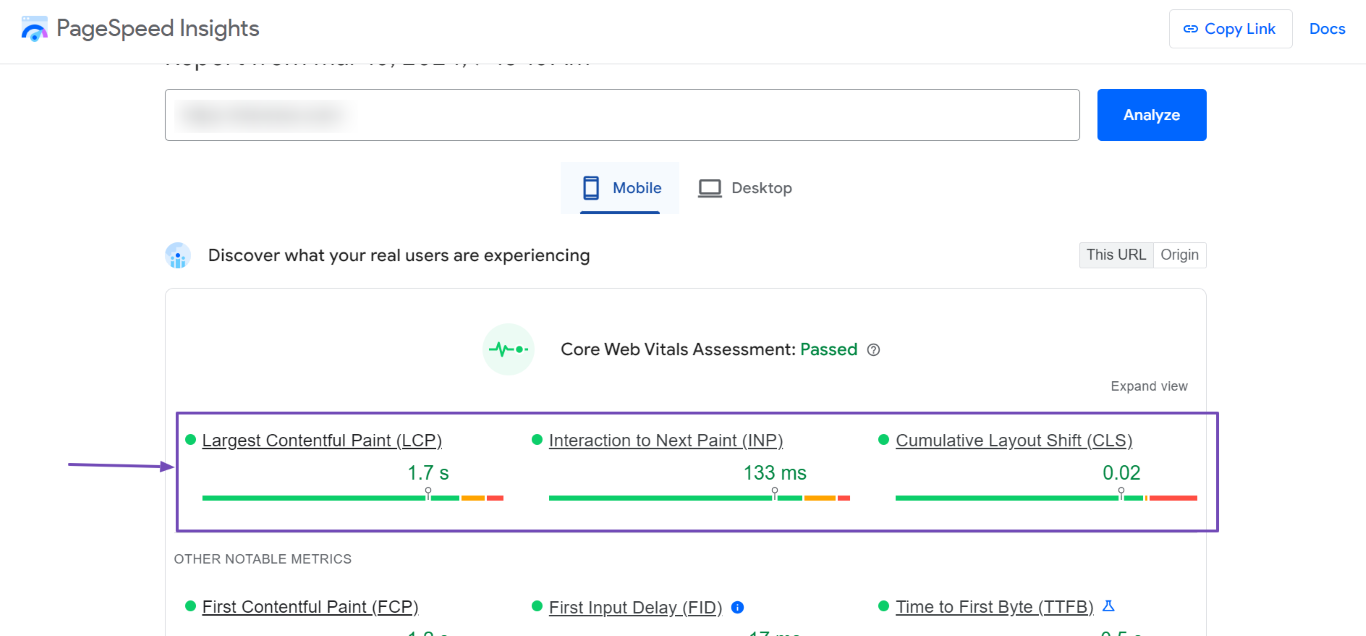
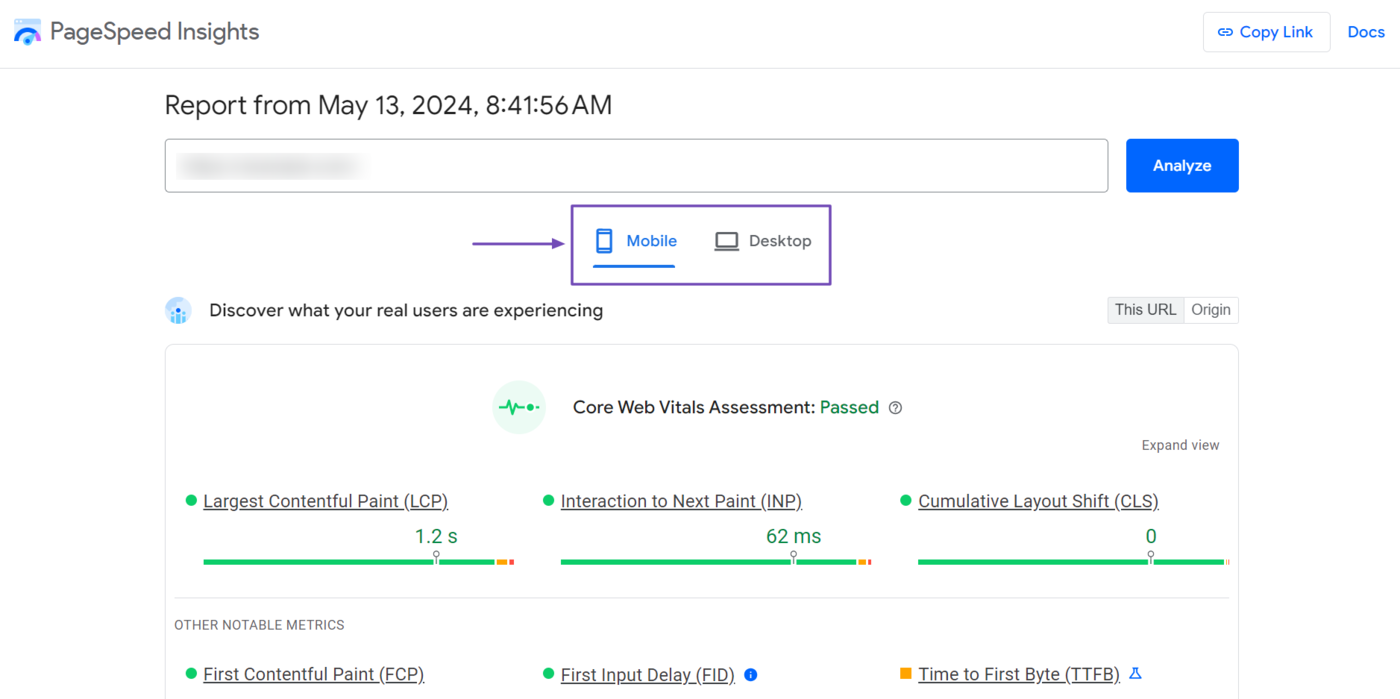
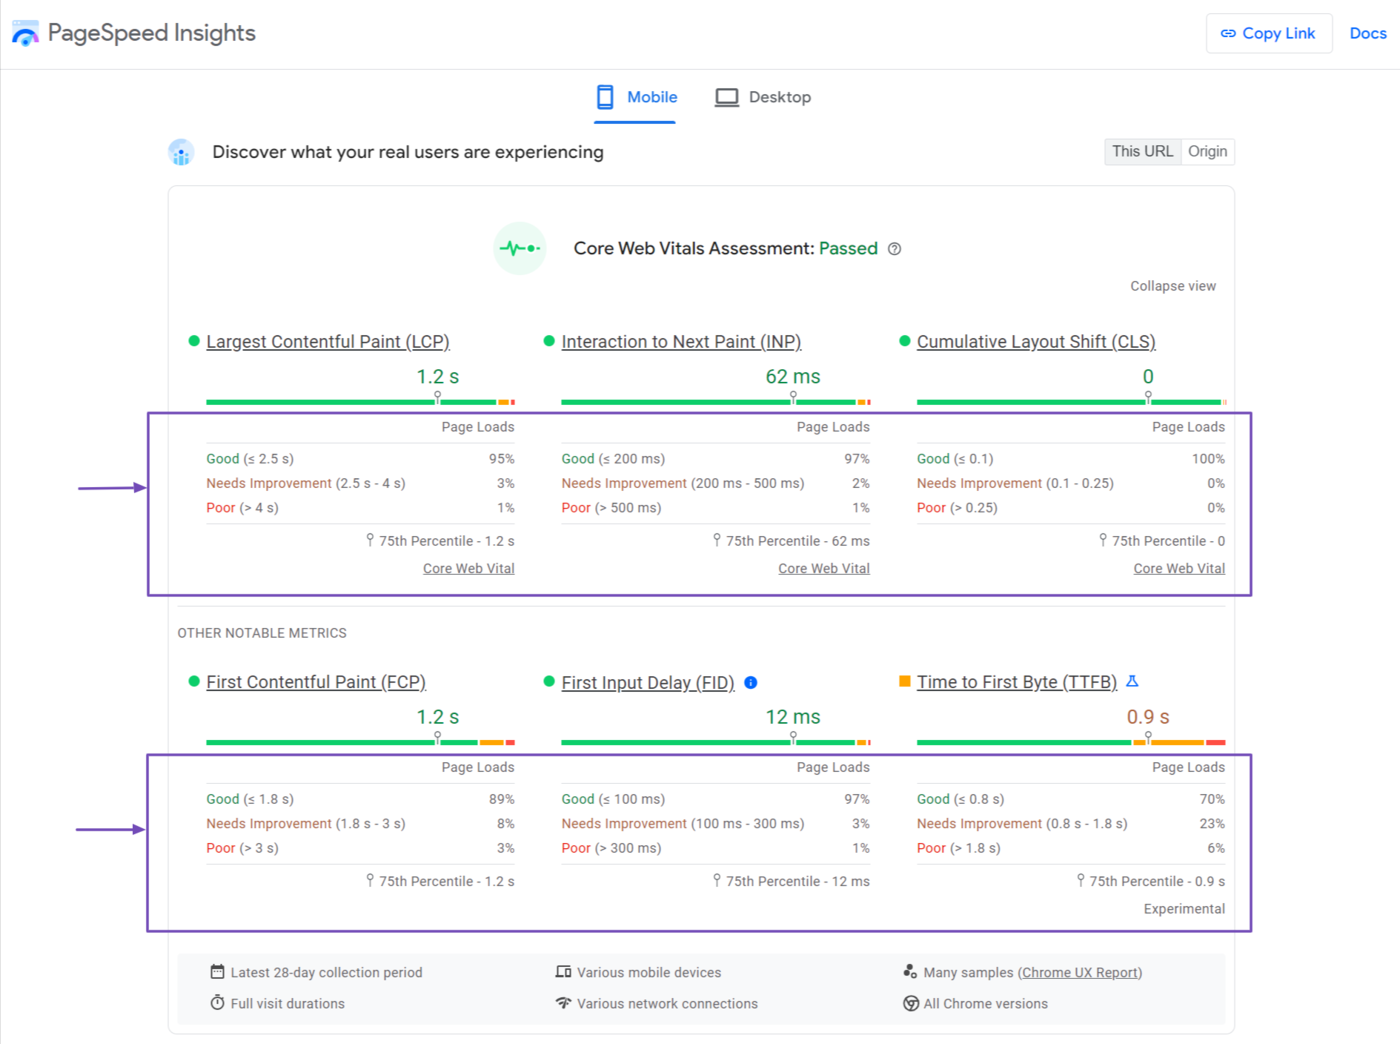
The Core Web Vitals and Other Notable Metrics are reported in the “Discover what your real users are experiencing field,” as shown below.
The metrics in this field are retrieved from the Chrome User Experience Report (CrUX) and reflect how real human visitors using the Google Chrome browser have experienced the page over the last 28 days.
However, the data reported is restricted to Chrome visitors that meet certain conditions, including:
- Enabled the “Help improve Chrome’s features and performance” option on their browser
- Did not set a passphrase on their browser
- Agreed to sync their browser history
- Use a supported Chrome browser
These are the only metrics retrieved from real-world visitors to your site and pages. The other metrics displayed in the PageSpeed Insights tool are retrieved from lab data from Lighthouse.
2 Performance
The Performance field reports on the speed and efficiency of the page. For this field, the PageSpeed Insights tool measures a series of metrics and uses them to calculate a performance score for the page.
The metrics used to calculate the performance score include:
- First Contentful Paint
- Largest Contentful Paint
- Total Blocking Time
- Cumulative Layout Shift
- Speed Index
You may observe that these metrics differ from those reported in the previous section. This is because the data in this field is based on lab data from Lighthouse. Lighthouse simulates page load in a controlled environment, not on real-world users.
3 Accessibility
The Accessibility field assesses whether a webpage’s code adheres to web accessibility guidelines and best practices.
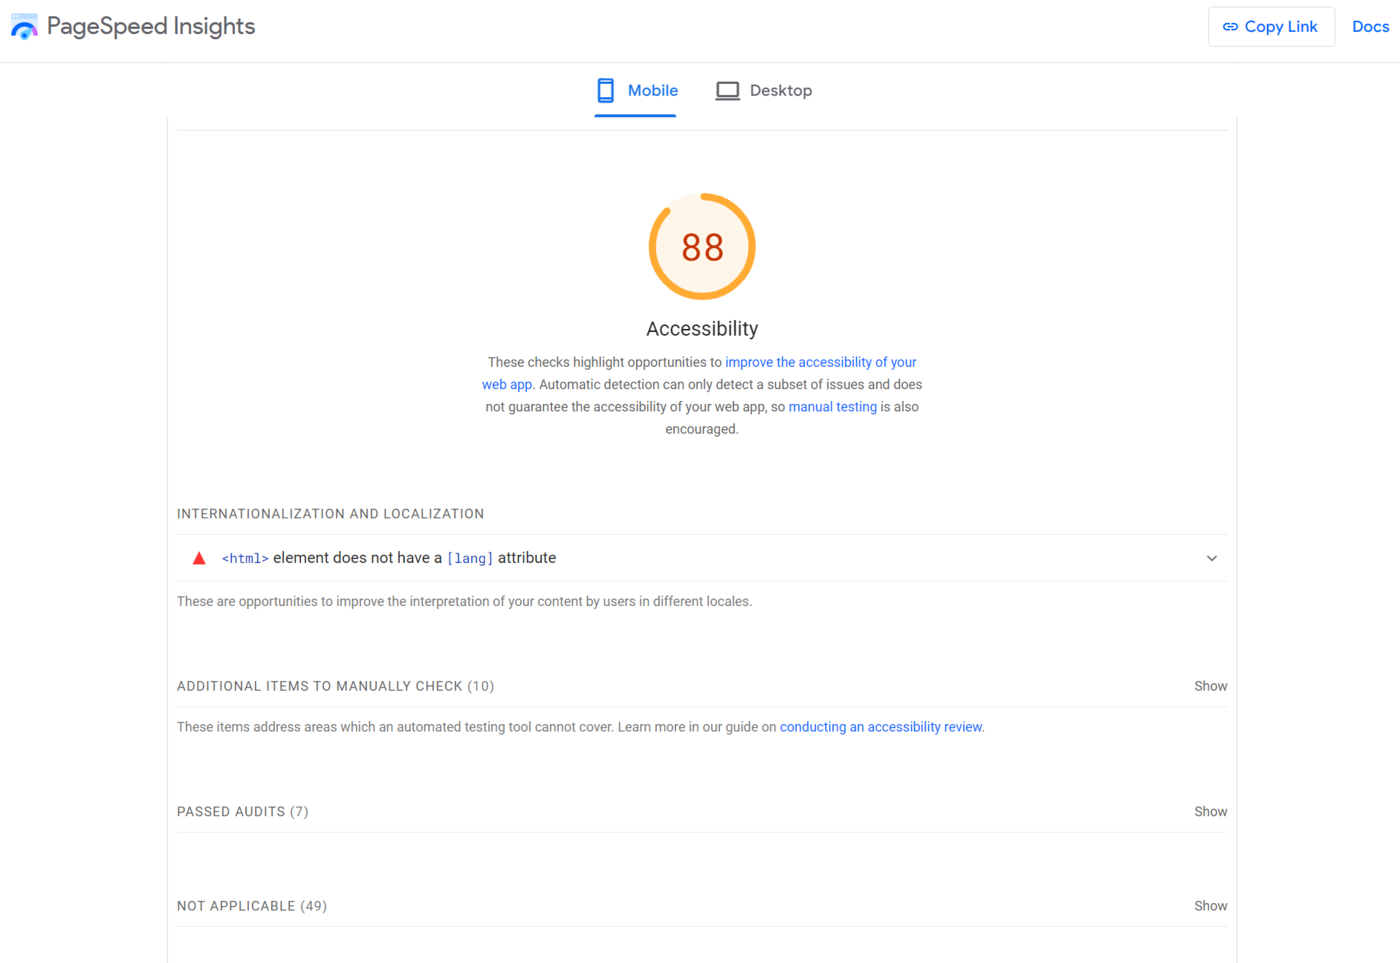
For this field, PageSpeed Insights analyzes the page’s HTML, CSS, and JavaScript code for several best practices, including the presence of proper headings and alternative texts. It also checks for adequate color contrast and the use of obsolete HTML tags.
It then reports its findings in the Accessibility section. However, the report’s structure depends on several factors, including the page accessed and the issues identified.
4 Best Practices
The Best Practices section assesses the page’s adherence to various web development best practices.
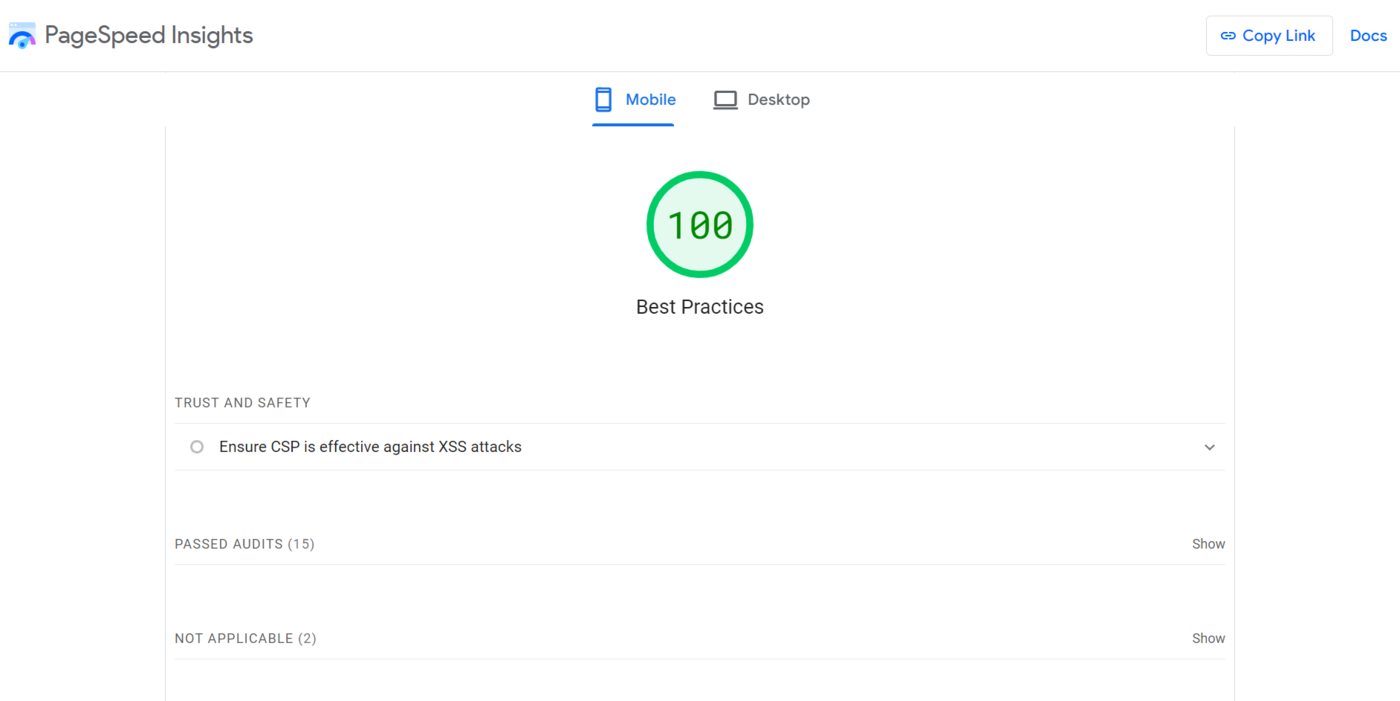
The PageSpeed Insights tool evaluates various aspects of the page’s code, structure, and configuration. For example, it will review your site’s mobile friendliness, use of secure HTTPS, and presence of code modifications.
It then lists some best practices that have yet to be applied to your site, along with those that have already been applied and those that do not apply. It then reports its findings along with actionable suggestions to improve your site.
5 SEO
The SEO section assesses how well your site conforms to SEO best practices.
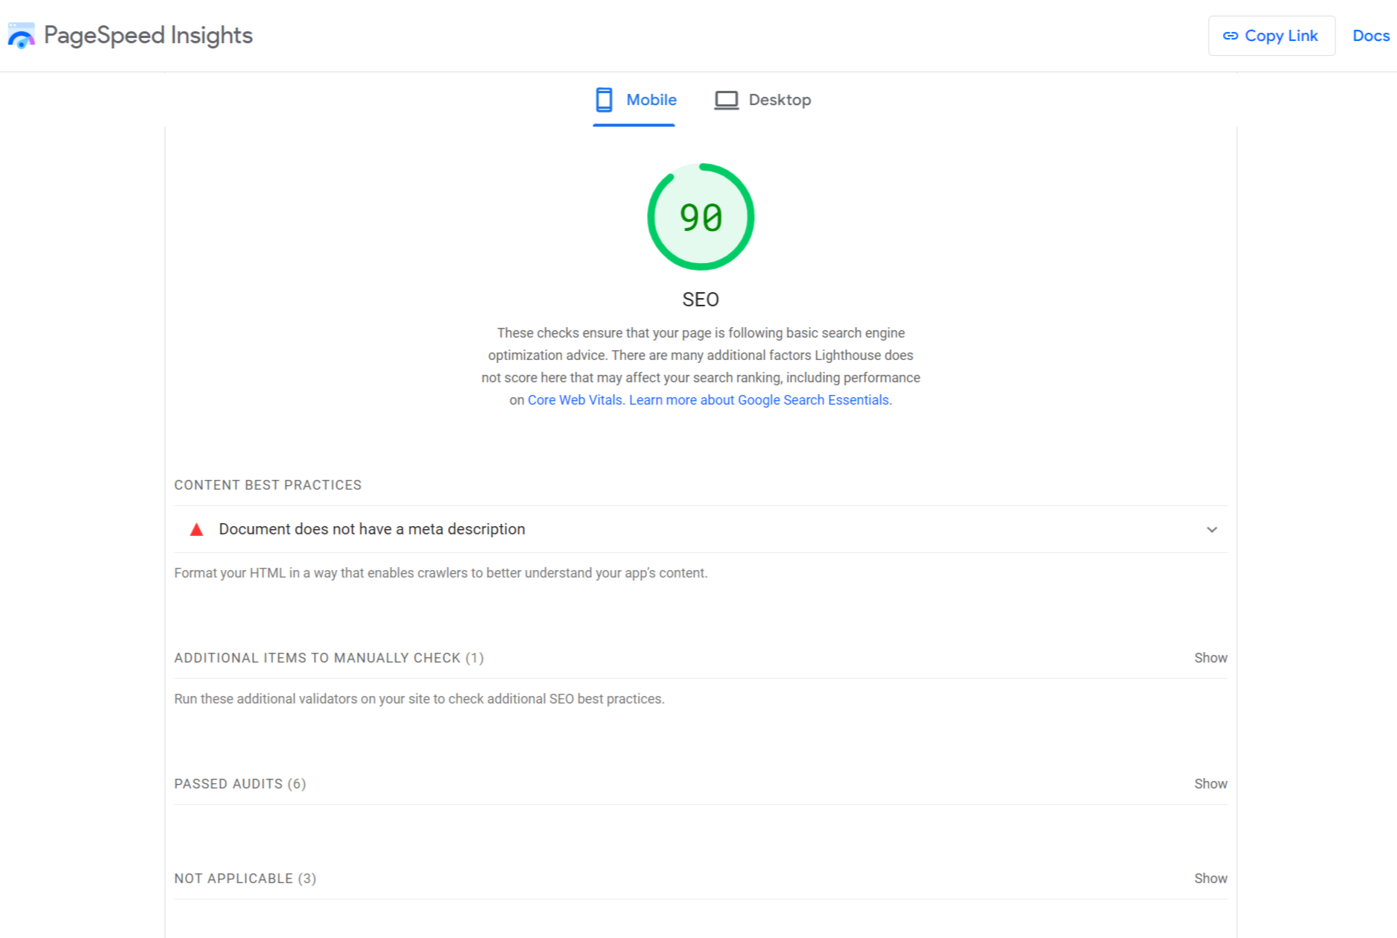
For example, the PageSpeed Insights tool checks whether the page has a title and a meta description. It also checks the crawlability of the links and the validity of your robot.txt file.
PageSpeed Insights then reports its findings, including the SEO practices that have not been applied, those you need to review manually, and those that have already been applied to your site.
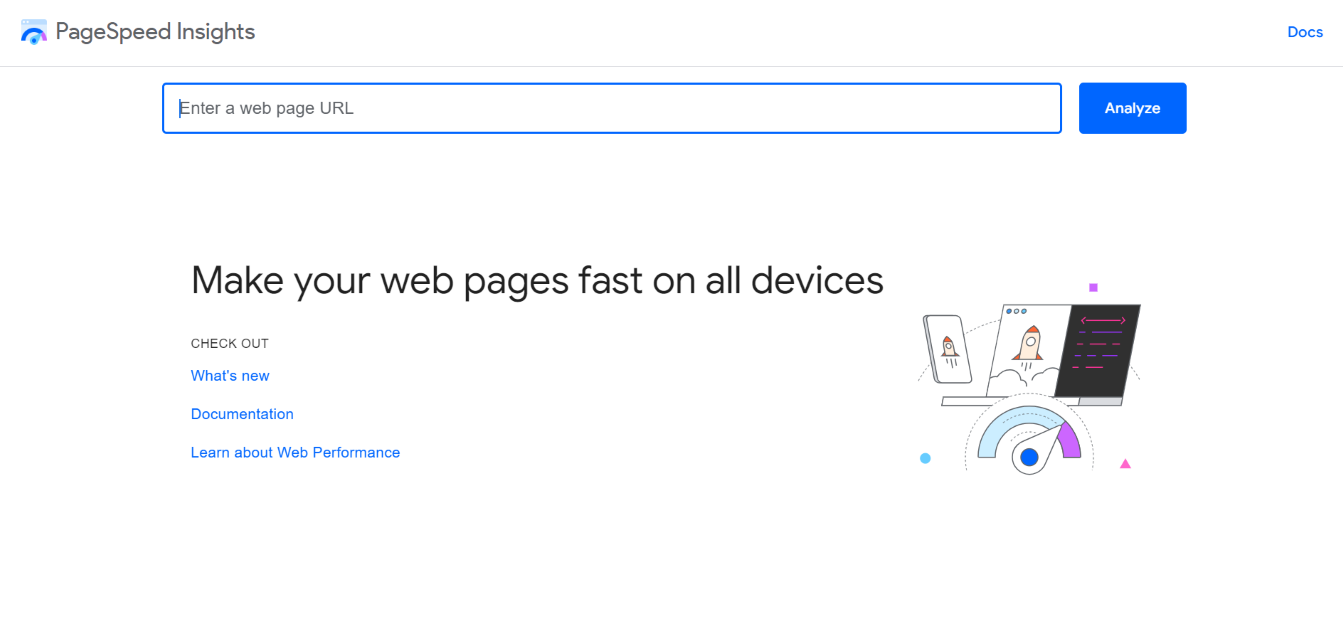
How to Use the Pagespeed Insights Tool
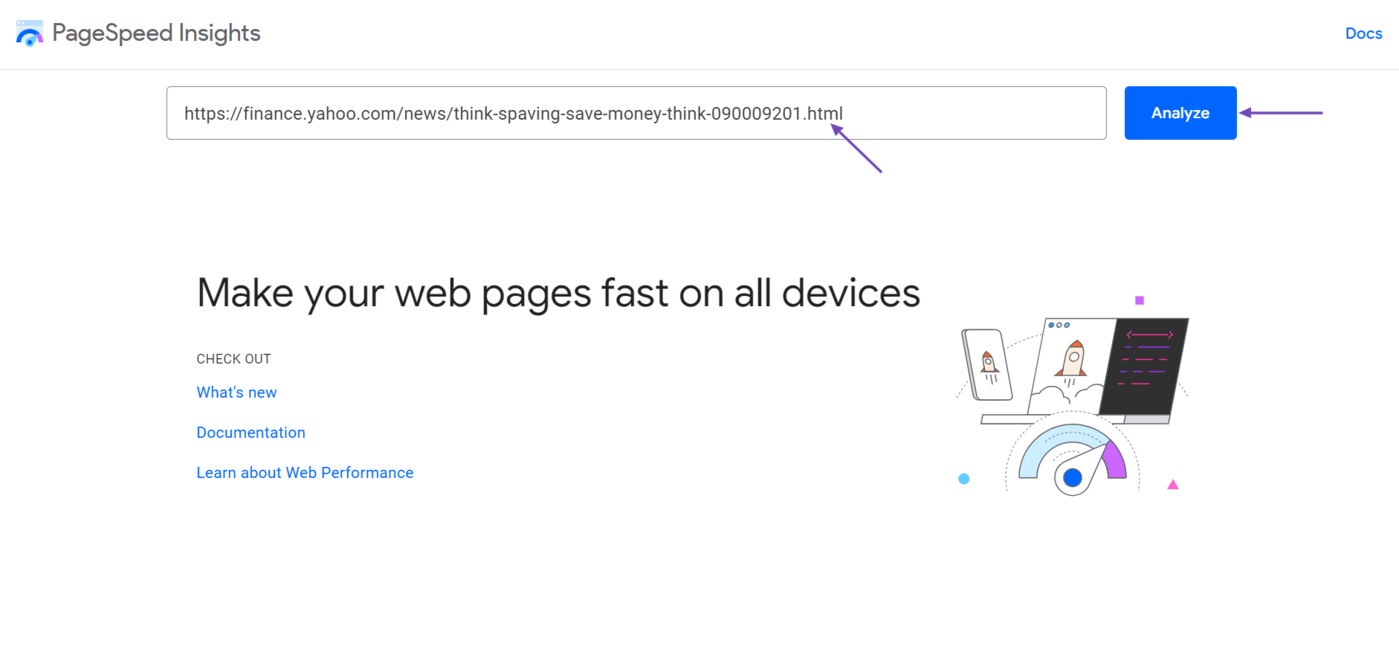
Head to the PageSpeed Insights tool webpage and enter the URL to analyze.
The PageSpeed Insights tool will then analyze the page and return with your Core Web Vitals assessments and other data. It will also present you with a series of recommendations to improve the performance.
Let’s go through the reported metrics and available options one by one.
1 Select Mobile or Desktop
The first option is to select between Mobile or Desktop.
- Mobile: Shows the metrics for visitors that visited your site using a mobile device
- Desktop: Shows you the metrics for visitors that visited your site using a desktop
You should pay attention to the metrics reported for both mobile and desktop since it is possible to pass the Core Web Vitals assessment for one device and fail for the other.
For example, a site can pass the Core Web Vitals assessment for desktop and fail for mobile.
Similarly, a page can pass the Core Web Vitals assessment for mobile and fail for desktops.
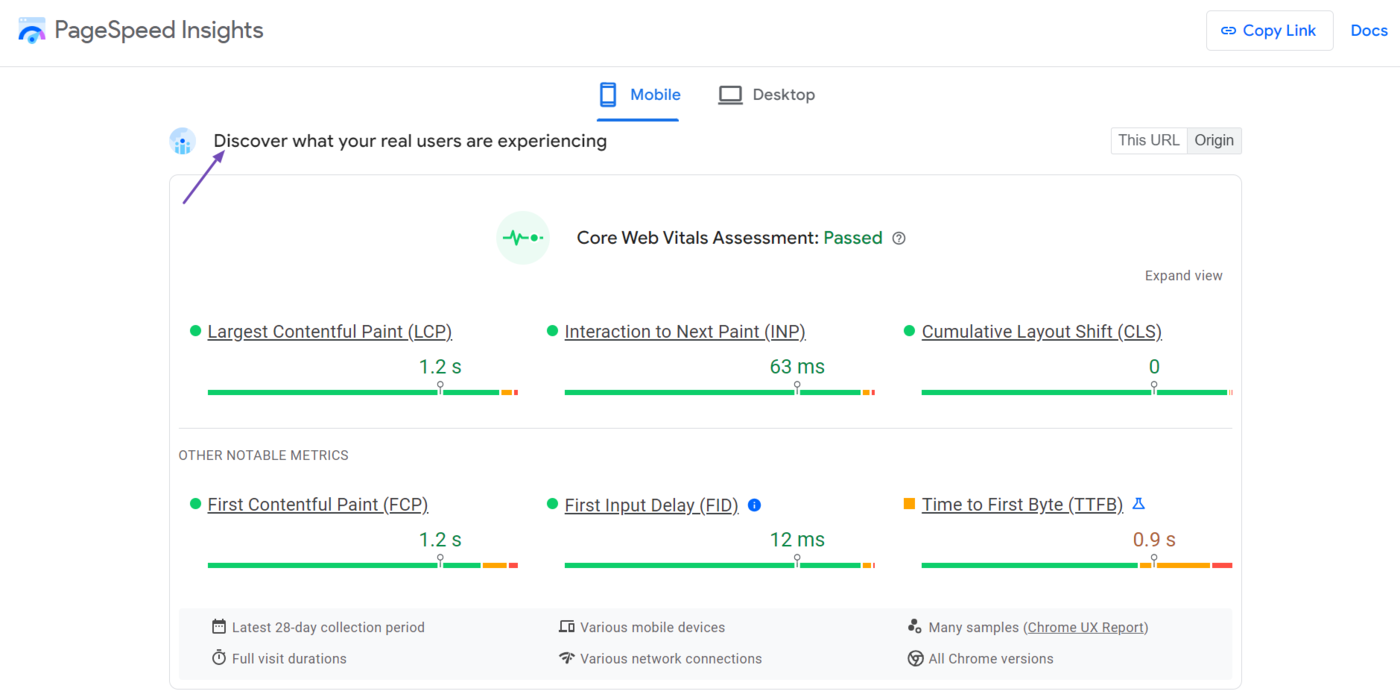
2 Select This URL or Origin
The metrics and data displayed are typically for the URL you entered into the search bar.
However, for the Core Web Vitals, PageSpeed Insights will also include the metrics of multiple pages on your site. In this case, you will select one of This URL or Origin.
- This URL: Will display the metrics of the URL you entered into the search bar
- Origin: will display the metrics of multiple pages on your site
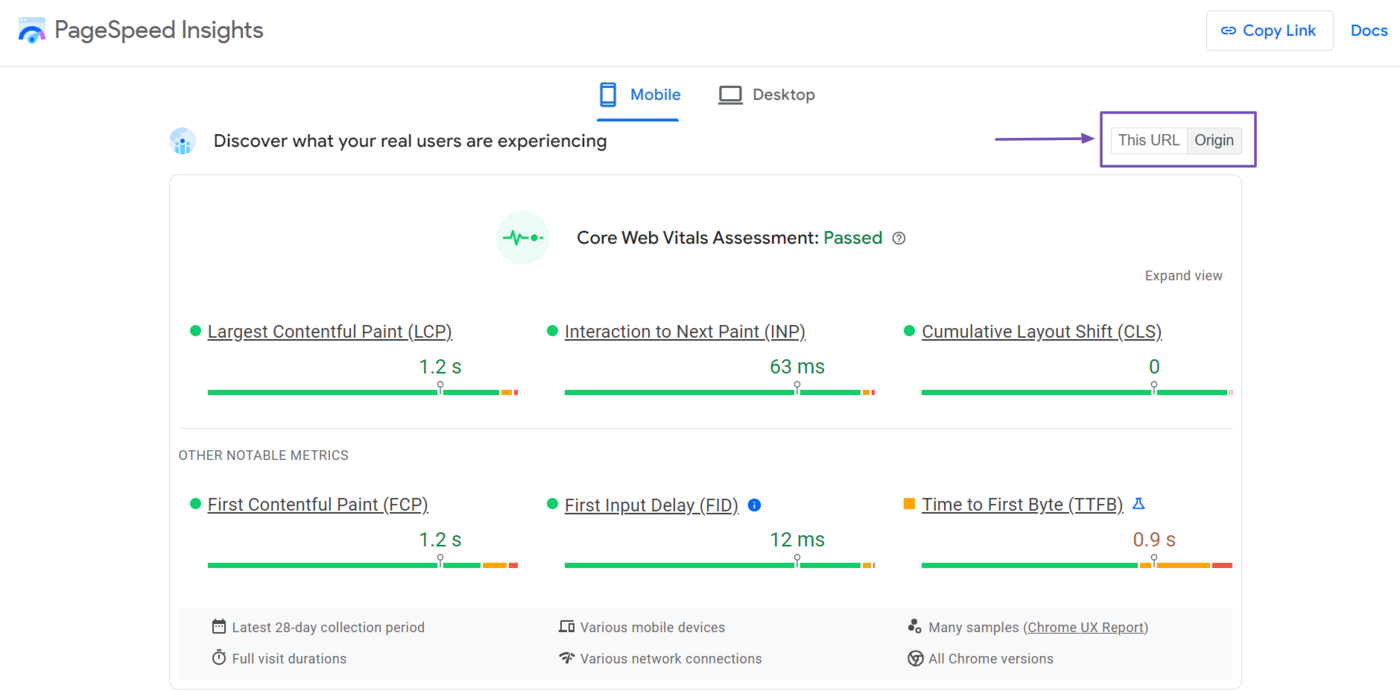
That said, the “This URL” option will be grayed out and unclickable if the Chrome User Experience Report does not have enough visitors to calculate the metric for that specific URL. In this case, you have to rely on the Origin data.
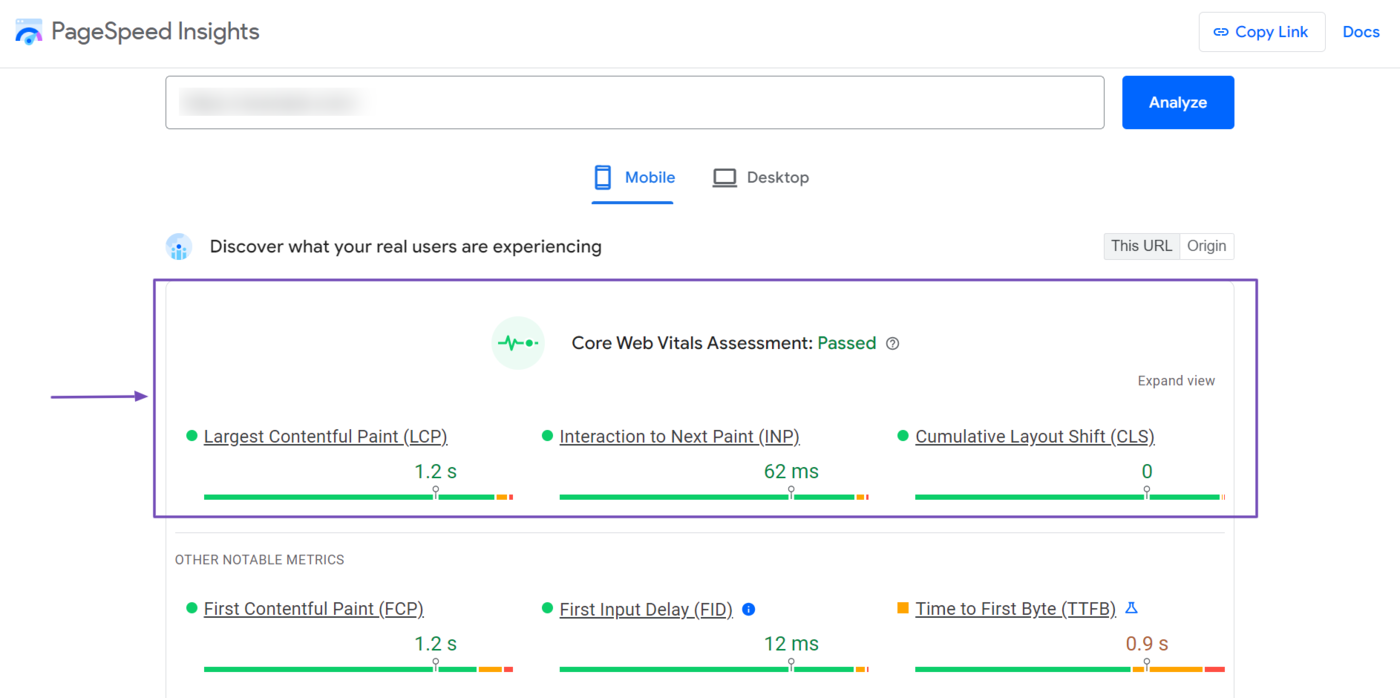
3 Review your Core Web Vitals Assessment
Once done, you can review your Core Web Vitals assessment. This assessment is calculated using your Core Web Vitals metrics:
- Largest Contentful Paint (LCP)
- Interaction to Next Paint (INP)
- Cumulative Layout Shift (CLS)
The metrics are color-coded green, orange, and red. The color provides information about how well you are faring for the metric:
- Green: The metric is okay
- Orange: The metric is okay but could be improved
- Red: The metric is not okay and should be improved
You can either pass or fail the assessment. Typically, you will fail the assessment if one of your Core Web Vitals metrics is too low.
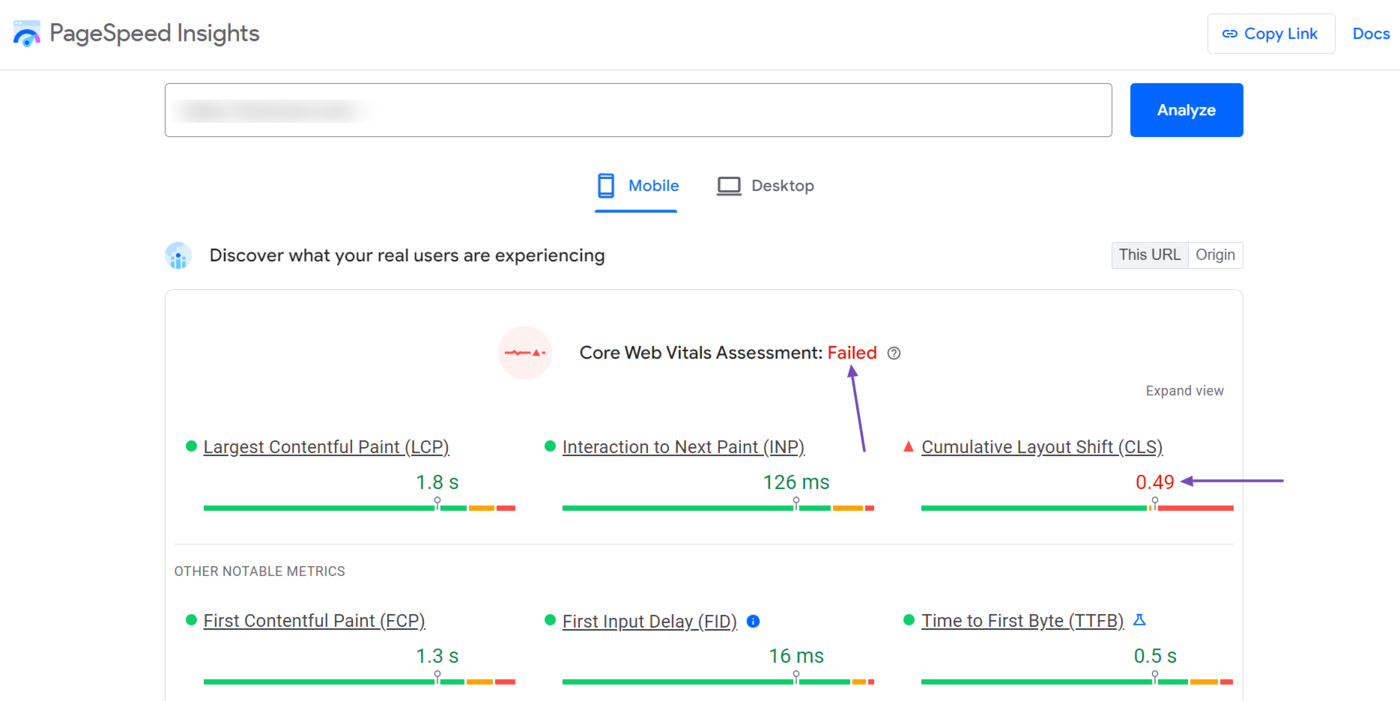
It is crucial to know that your Core Web Vitals assessment is determined using the 75th percentile. That is, it is calculated based on how 75% of your visitors experience your site.
You can click Expand view to get more insights into the metrics.
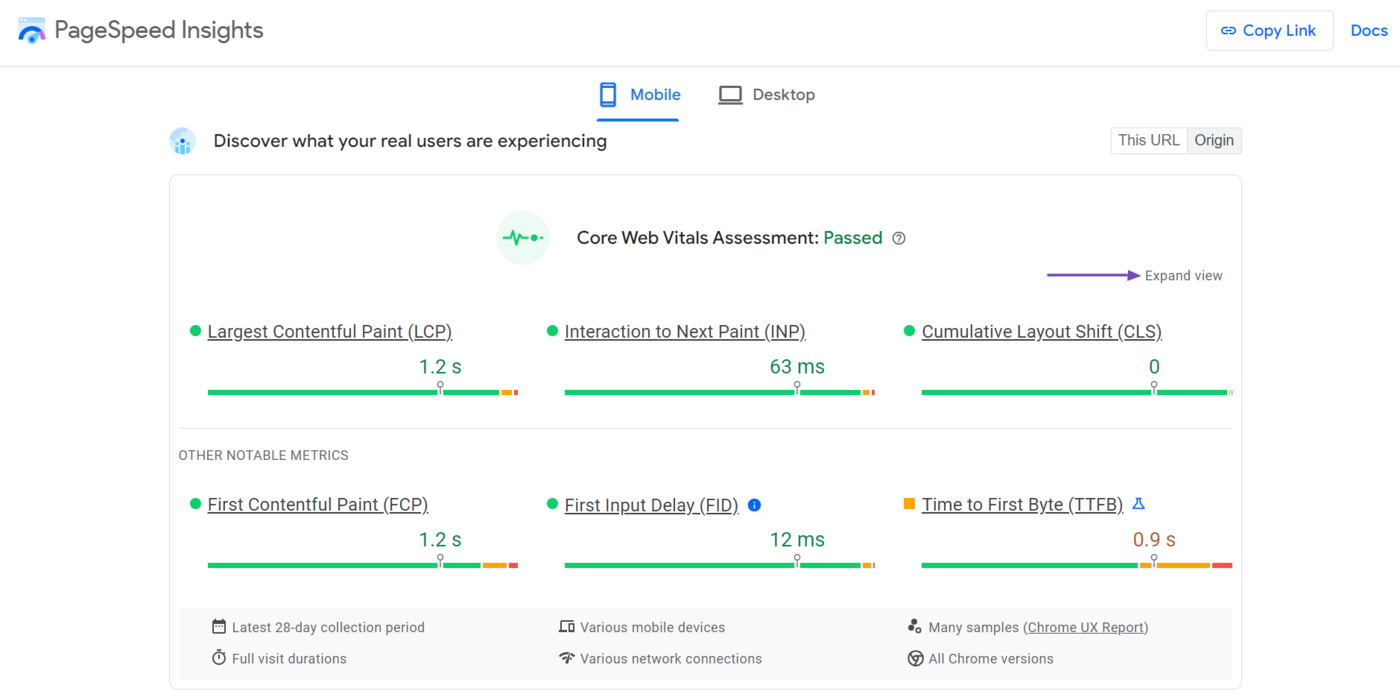
The expanded view will display more information about your metrics, including:
- The ideal grade to pass the test
- The percentage of visitors that experienced each grade
4 Review your Performance Metrics
Once done, navigate to the Diagnose Performance Issues field. Typically, you want to focus on your performance score since it is calculated using some of the metrics used for your Core Web Vitals.
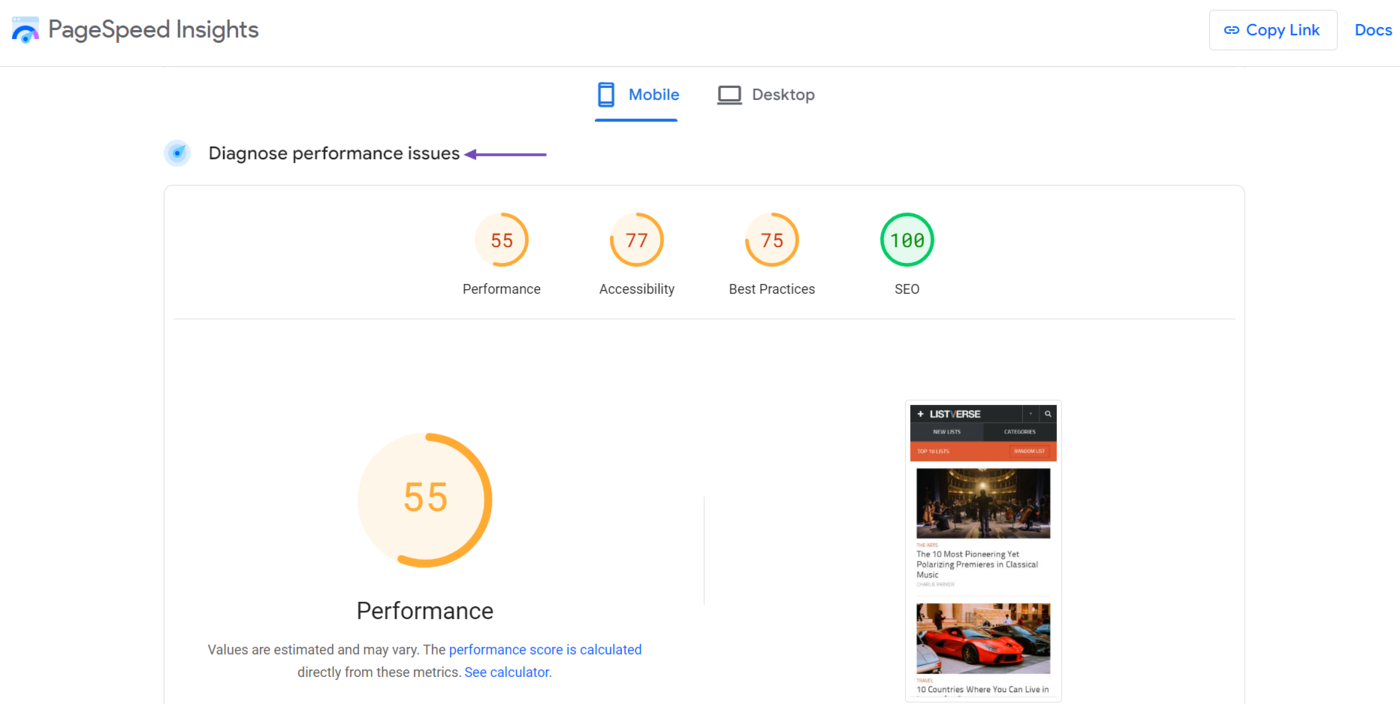
It is crucial to note that the reports in this “Diagnose performance issues” field are based on assessments by the PageSpeed Insights tool. The results are not from human visitors to the page.
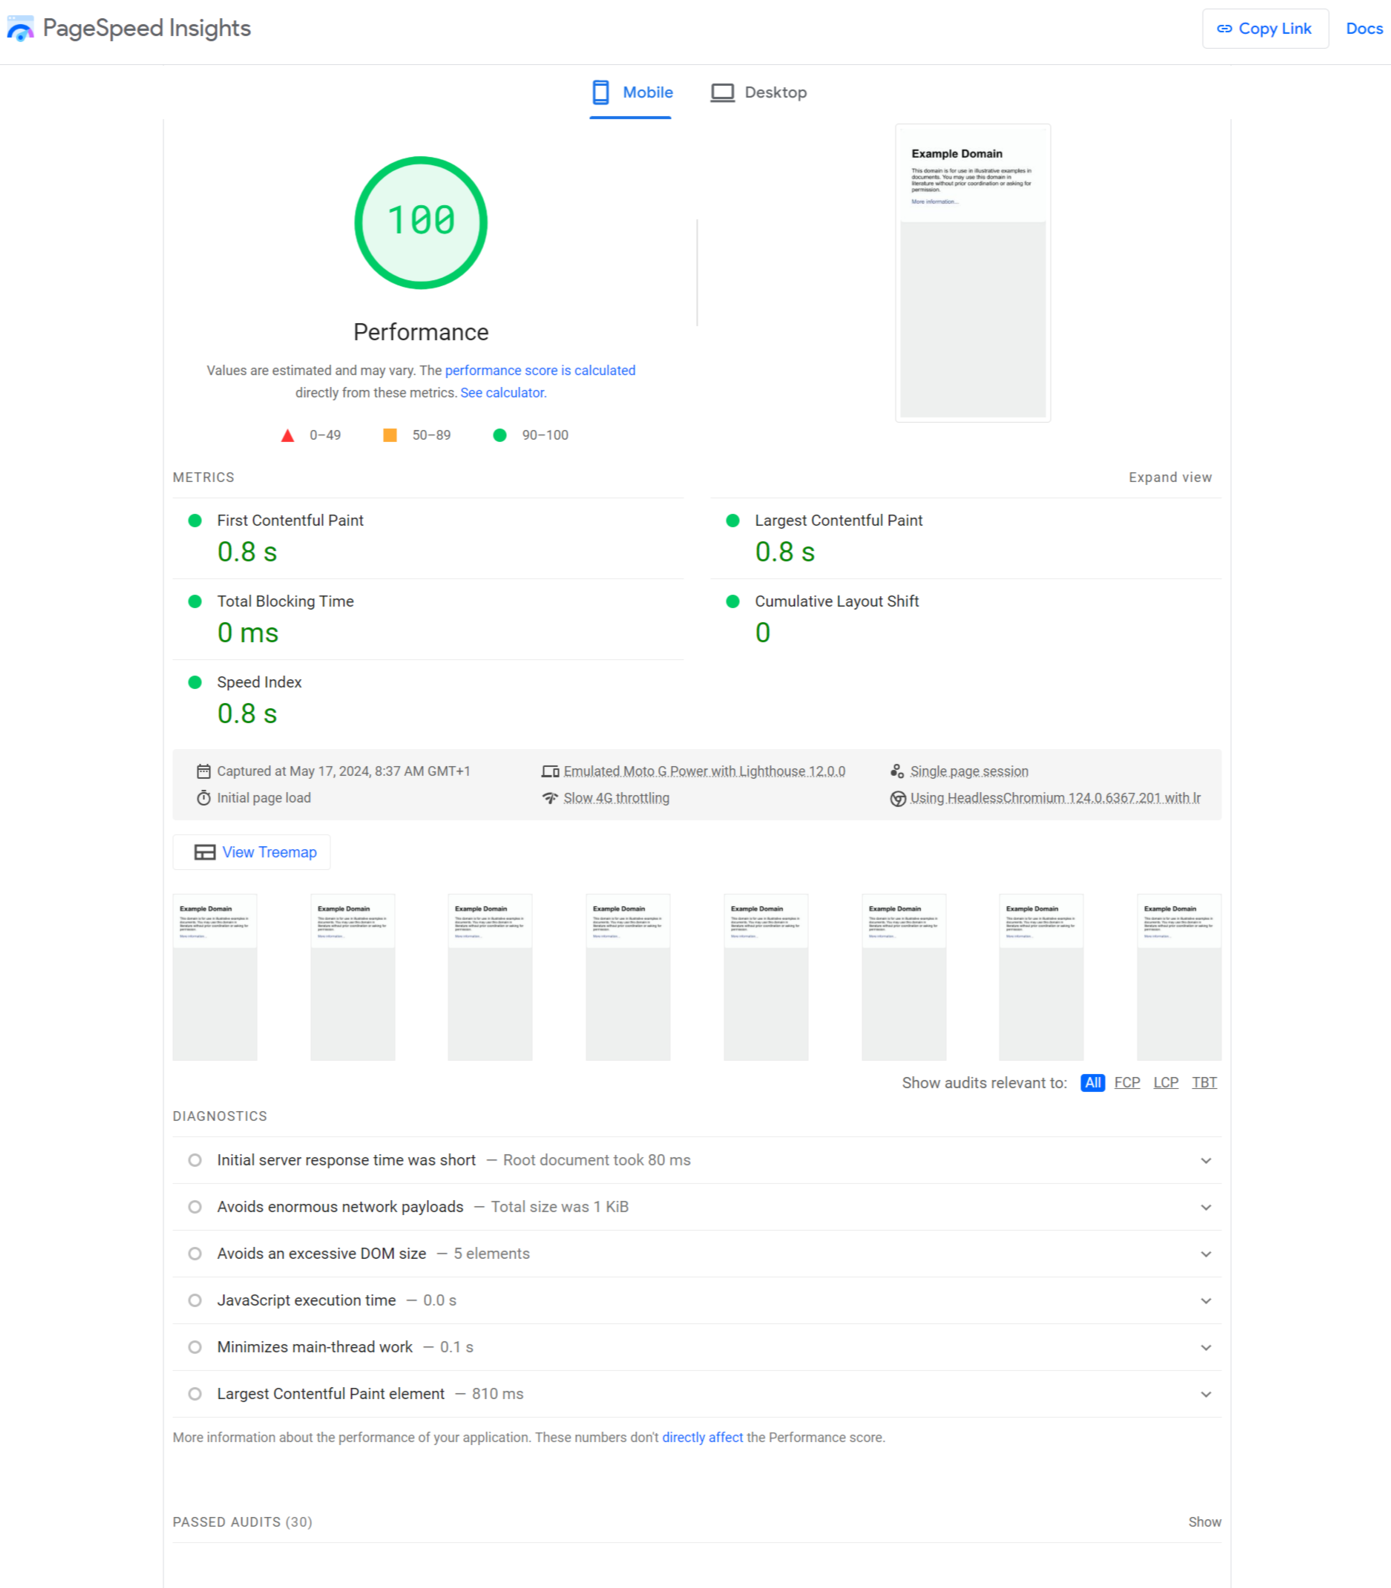
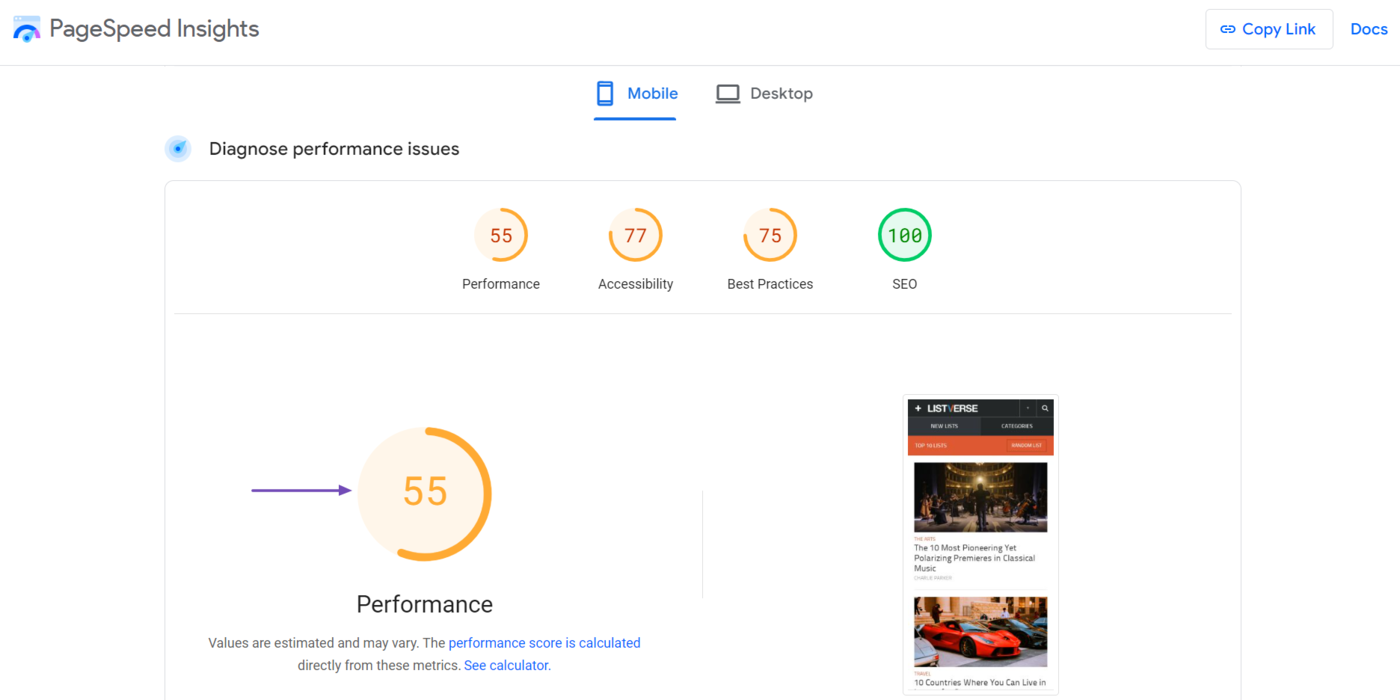
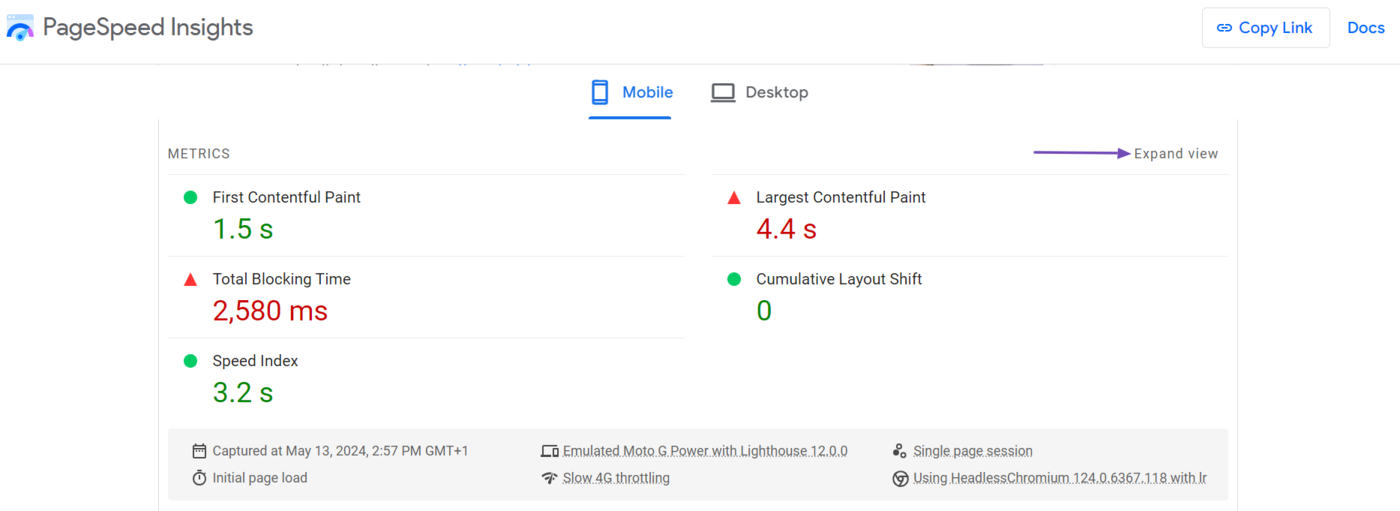
At the top is the Performance metric, which contains the performance score for the page.
The performance score is calculated using several metrics. As usual, the metrics are color-coded, and you can hover over the score to see how each metric is faring.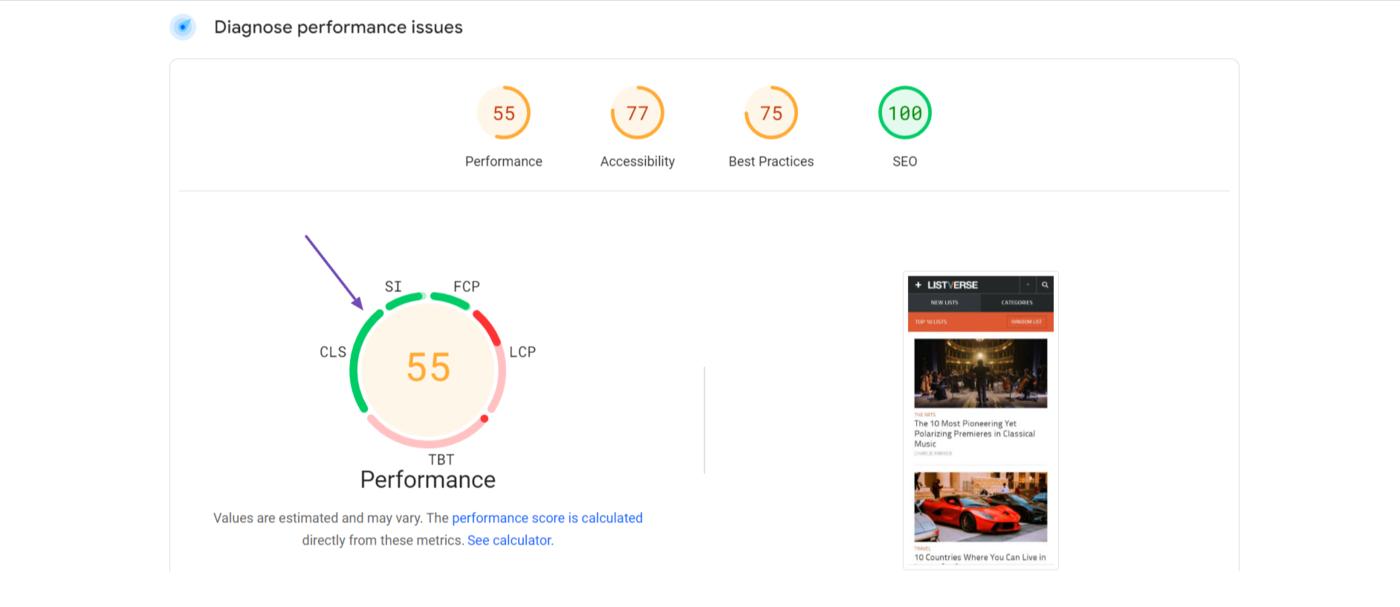
To the right is a screenshot of the URL as it currently appears. You can switch between the mobile and desktop performance metrics by clicking the respective button at the top of the page.
Clicking the button will also display the Performance score for the mobile and desktop metrics.
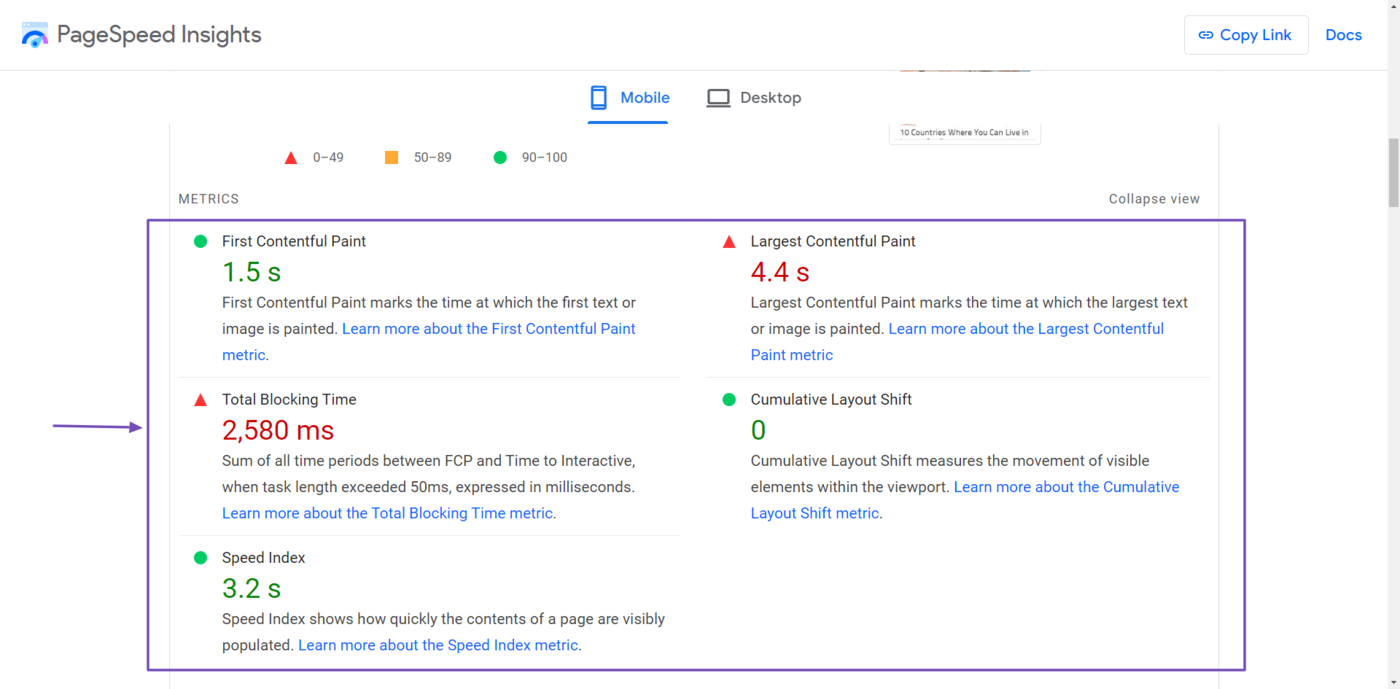
Below the performance score are the metrics used to calculate the score. You can click Expand view for more insights into the metrics.
The field will expand and display the definition of the metrics.
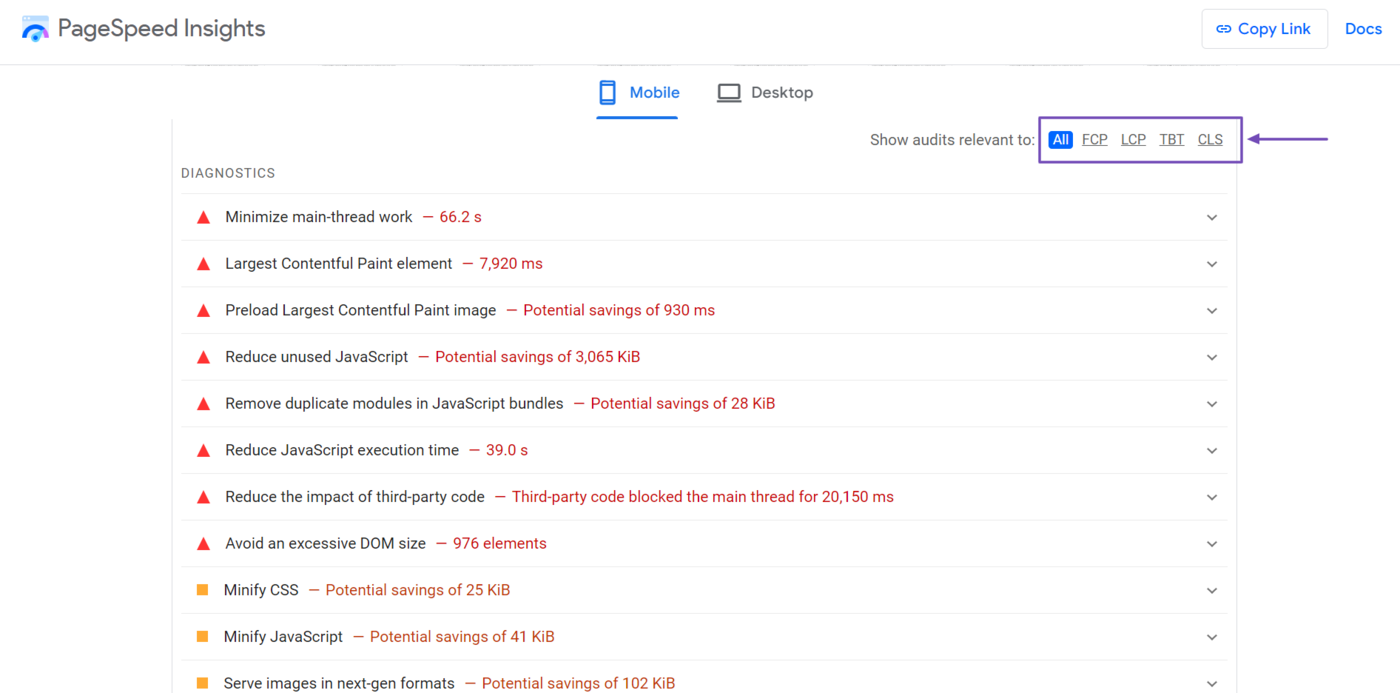
Next are the diagnostics.
The Diagnostics field shows you improvements you could make to the page. These are not used to calculate the performance score, but improving them may help improve the metrics used to calculate them.
The field shows all suggested improvements by default. You can display suggestions unique to a metric using the Show audits relevant to options. However, the exact options displayed differ from page to page.
Once done, you can scroll down to view the audits you passed. Click Show to view the audits.
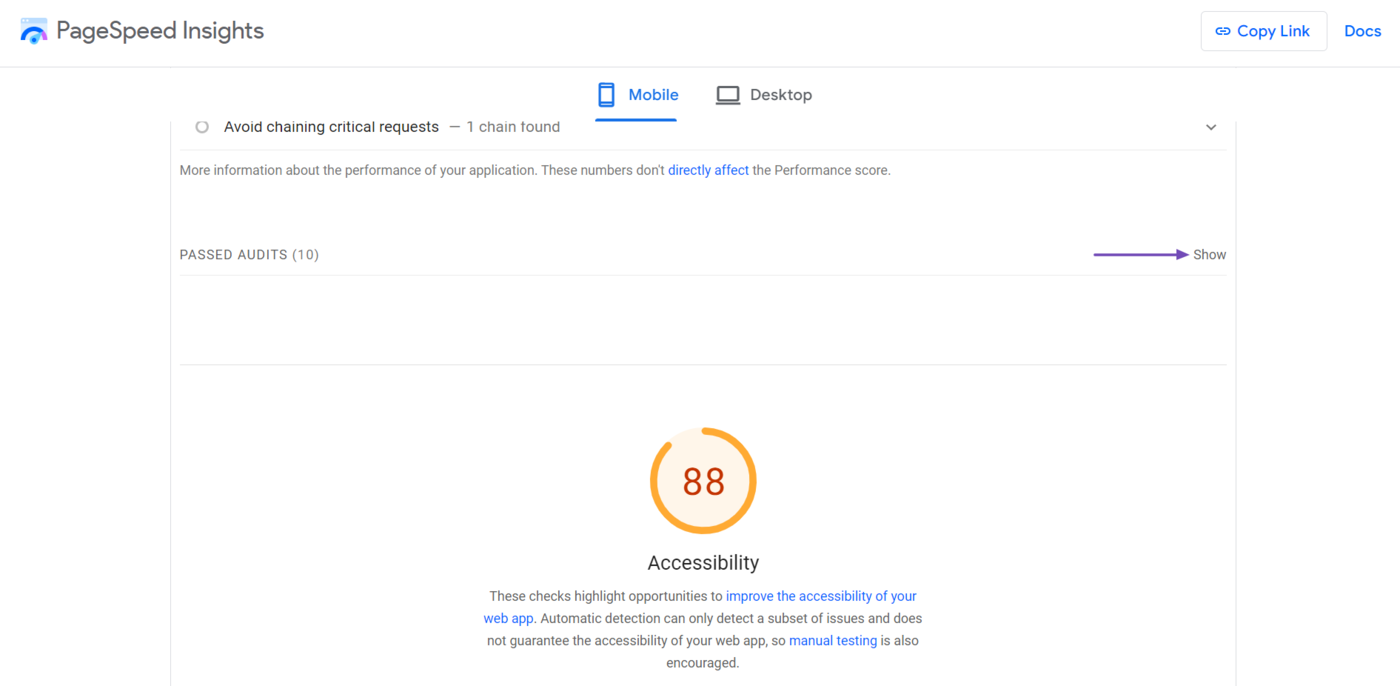
Once you’ve done this, you can proceed to review the Accessibility, Best Practices, and SEO audit sections. These reports are based on an assessment by the PageSpeed Insights tool and do not come from real-world visitors to your site.
It is crucial to point out that they are not metrics either and are just suggestions to improve your site. That said, improving them will typically make your site more usable for your visitors.